This seminar is addressed to students of all faculties and fields of study who want to learn how to visualize their own research results, designs, analyses and simulations on desktop, but also in augmented and virtual reality. Another key objective of the seminar is to promote interdisciplinary cooperation and to support scientific exchange beyond the boundaries of one’s own discipline. The seminar is conducted in German, but support can also be provided in English if required.
The knowledge acquired should ideally serve the participants as a supplement and support for other courses, seminar and master theses or dissertations. However, this is not a precondition for attending the course.
The course also supports the “Smart Campus” project.
Registrations are open in the campus information system TISS from 14 September until 20 October for TU Wien students only. The course will take place at the TU Library (TU Bibliothek) in its newly installed Data Visualisation Lab.
Module 1, Introduction:
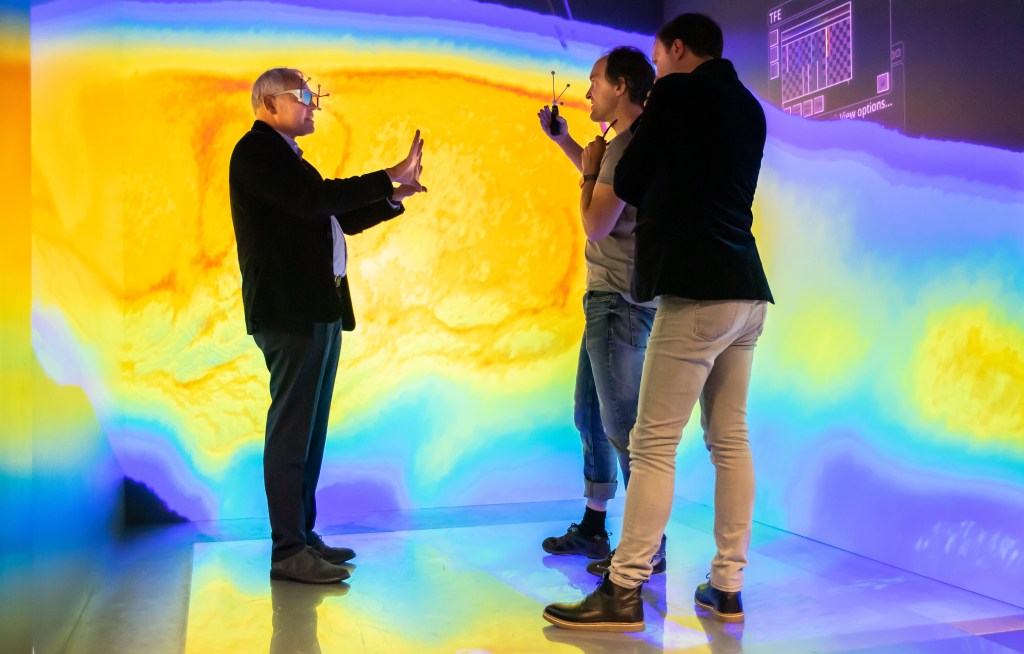
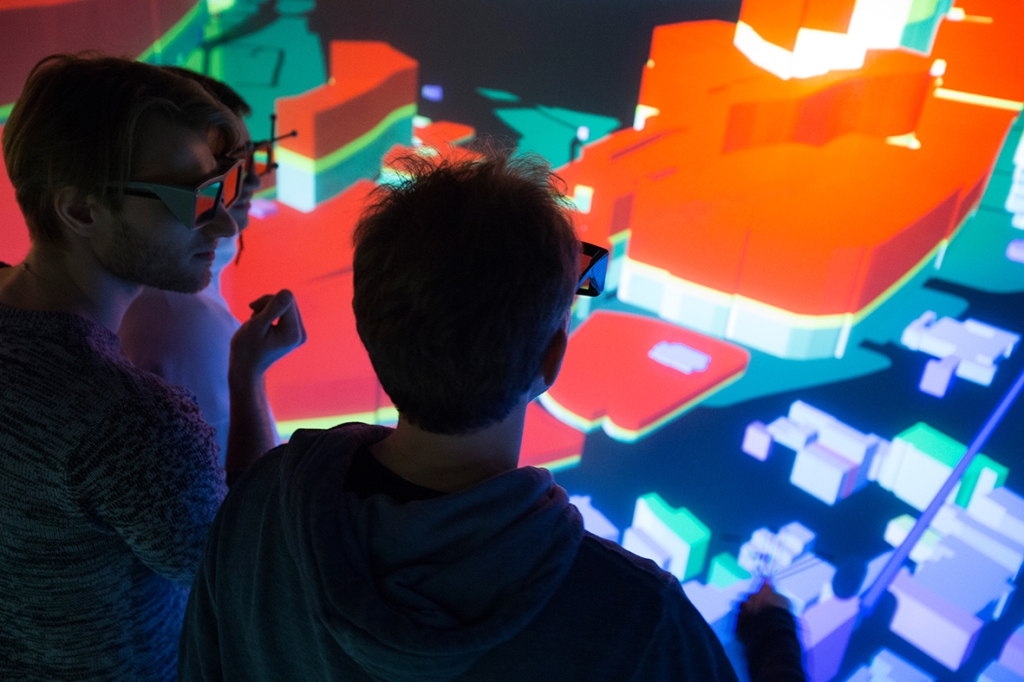
In an introduction, an overview of visualisation technologies and scientific visualisation and their applications in practice is given. In the Data Visualisation Lab of the TU Library, the possibilities of scientific visualisation in virtual reality can be experienced practically. Depending on the interests and professional backgrounds of the participants, these can be data from the disciplines of mechanical engineering, civil engineering, architecture, spatial planning, geoinformation and geosciences, chemistry, physics, medicine, biology and other subject areas.
Module 2, Basics of scientific visualisation in VR/AR:
During a practical introduction the participants will be able to learn the basics of 3D desktop visualisation with COVISE. In addition, a workshop will be held to discuss how to create interactive 3D models for virtual environments and how augmented reality visualisations can be implemented.
The aim of this module is to enable the participants themselves to create visualisations and to visualise them on end devices ( Display, Head Mounted Display (HMD), Virtual Reality etc.). This knowledge is to be applied in own research and study projects.
Module 3, Bring your own data:
The third module deals with the visualisation of models, analyses and simulations created by the participants themselves as part of their research and student research projects. These are to be presented in the Data Visualisation Lab and subsequently optimised in a workshop and further variants are to be discussed.
Lecturers: Dr.-Ing. Uwe Wössner (HLRS) and DI Dr. Fabian Dembski (HLRS)
Course registration from 14 September to 20 October via TISS